
Last time, we tracked the year-by-year data, testing the proposition that most of the Court’s cases are sufficiently “close calls” to have brought a dissent at the Appellate Court. This week, we’re testing another proposition – does dissent at the Appellate Court suggest that there’s going to be one or more dissenters at the Supreme Court?
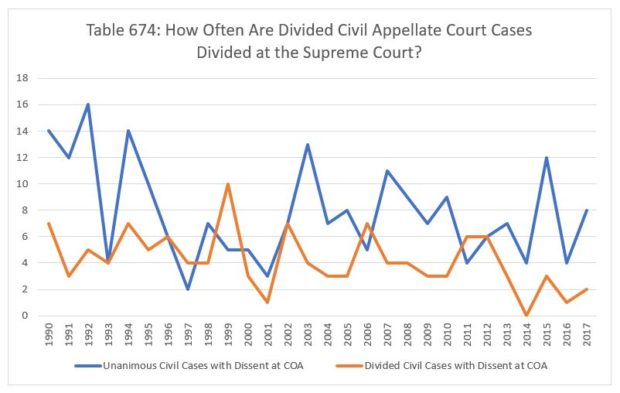
In Table 674, we track the absolute numbers – how many of the Court’s unanimous civil decisions had a dissent below versus how many of the Court’s non-unanimous decisions did. We see in the blue line that in most years – twenty of twenty-eight, to be precise – there are more unanimous decisions than non-unanimous ones arising from divided decisions below.
In Table 675, we report the same data with the number of divided Appellate Court decisions on each side of the ledger reported as a portion of the whole: in other words, if the Court decided three civil cases unanimously, and one had a dissent at the Appellate Court, then we would report 33.33%.
Evaluated this way, it begins to appear that dissent at the Appellate Court is not a strong predictor of dissent at the Supreme Court. A higher portion of non-unanimous civil decisions had a dissent below in fifteen of the twenty-eight years.
In 1990, 20% of the unanimous civil cases and 36.84% of the non-unanimous ones had a dissent below. In 1991, 30% of the unanimous decisions and 23.08% of the non-unanimous ones did. In 1992, 25.81% of the unanimous decisions had a dissent below, but only 16.67% of the non-unanimous ones did. In 1993, 16.67% of the unanimous decisions and 28.57% of the non-unanimous ones had a dissent below. The following year, 34.15% of the unanimous decisions and 20.59% of the non-unanimous decisions had a dissent below. In 1995, the numbers were roughly equal – 28.57% of unanimous decisions and 23.81% of non-unanimous ones had a dissent below. In 1996, 17.65% of unanimous civil decisions and 28.57% of non-unanimous decisions had a dissent below. In 1997, the numbers dropped on both sides, to 6.45% of unanimous decisions and 12.5% of non-unanimous decisions. In 1998, 20.59% of unanimous decisions and 10.81% of non-unanimous decisions were divided below.
In 1999, a quarter of unanimous civil decisions had a dissent below, but 47.62% of non-unanimous decisions did. In 2000, 22.73% of unanimous decisions and 18.75% of non-unanimous decisions were divided below. In 2001, both sides fell sharply – 7.89% of unanimous decisions, 7.69% of non-unanimous cases. The following year, 21.21% of unanimous civil decisions had a dissent below, but 41.18% of non-unanimous cases did. In 2003, the relationship flipped – 28.57% of non-unanimous decisions were divided below, but 40.63% of unanimous decisions were. In 2004, 17.5% of unanimous decisions were divided, but 21.43% of non-unanimous decisions were.
For the next two years, the share on both sides was fairly stable – 20.51% (2005) and 17.24% (2006) for unanimous decisions, 33.33% (2005) and 35% (2006) for non-unanimous cases. In 2007, a third of the unanimous civil decisions were divided below, but fully half of the non-unanimous decisions were. In 2008, 30% of unanimous decisions were divided below, and a third of non-unanimous decisions were. In 2009, 20.59% of unanimous decisions and 42.86% of non-unanimous decisions were divided. In 2010, the numbers were close to equal – 37.5% of unanimous decisions and one-third of the non-unanimous civil decisions. In 2011, only 13.79% of the unanimous civil decisions had a dissenter below, but two-thirds of the non-unanimous decisions did. The following year, things were much closer again, as 27.27% of the unanimous decisions and a third of the non-unanimous decisions were divided below. In 2013, 35% of unanimous decisions and only 21.43% of non-unanimous decisions had a dissenter. In 2014, 19.05% of unanimous decisions had a dissenter below, but none of the non-unanimous cases did. In 2015, 34.29% of unanimous decisions had a dissenter below, and a third of the non-unanimous cases did. In 2016, 19.05% of unanimous decisions were divided, but only 14.29% of non-unanimous cases were. Last year, 38.1% of the Court’s unanimous civil decisions had a dissenter below, and 40% of the non-unanimous decisions did.

Join us back here next time as we review the Court’s criminal docket.
Image courtesy of Flickr by Marco Verch (no changes).